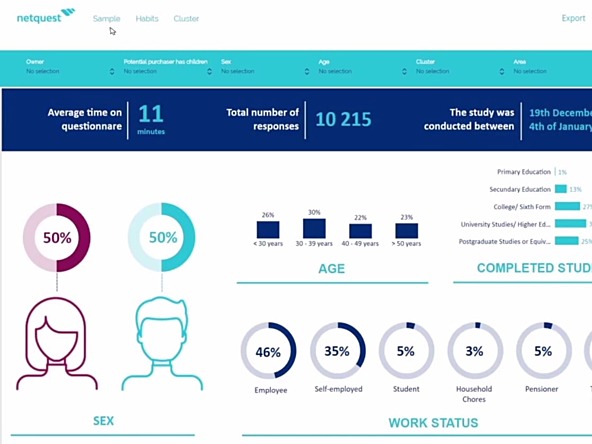
Netquest launches data visualisation service

The solution, which incorporates infographics, tables and charts, includes the creation of customised dashboards for clients.
The technology supports advanced time series, moving average and weighted time series, allows the automatic cluster of net brands to one series, and quantitative data to be combined with unstructured data.
Marc Smaluhn, Europe managing director at Netquest, said: “Today’s world is more visual than ever. This panorama demands new solutions to adapt out-of-date market research reports to the new needs in a visual, and immediate way.”

We hope you enjoyed this article.
Research Live is published by MRS.
The Market Research Society (MRS) exists to promote and protect the research sector, showcasing how research delivers impact for businesses and government.
Members of MRS enjoy many benefits including tailoured policy guidance, discounts on training and conferences, and access to member-only content.
For example, there's an archive of winning case studies from over a decade of MRS Awards.
Find out more about the benefits of joining MRS here.


0 Comments